

Establishing a Clear Framework for Contractor Marketing Investments
Most trade contractors should spend between 5% and 12% of gross revenue on marketing, depending on company maturity and growth goals. As a general standard, allocate 5% to 8% to maintain current volume, 8% to 12% to fund aggressive growth, and 10% to 15% for new operations establishing market share during their first two years.
Setting a marketing budget is an operational decision, not an emotional one. When trade business owners guess their marketing budget, they usually swing between two extremes: overspending on disconnected lead generation when the schedule is empty, or cutting spend entirely when crews are booked solid. Both habits create volatile cash flow and unpredictable dispatch boards.
To build a reliable budget, calculate your baseline using five foundational operational metrics:
- Trailing 12-Month Gross Revenue: Always base percentages on actual historical collected revenue, never on hopeful revenue targets for the coming year.
- Gross Profit Margins: Your direct job costs (labor, materials, subcontractors, and equipment) dictate how much margin remains to fund customer acquisition. A trade operating at a 45% gross margin has far more room to acquire customers aggressively than one operating at 28%.
- Average Job Value and Close Rates: A commercial electrical contractor closing 25% of estimates at an average ticket of $18,000 requires a completely different lead volume and budget model than a residential service plumber closing 65% of diagnostics at $450.
- Crew Capacity and Dispatch Thresholds: Your marketing spend must match the maximum capacity of your field technicians. Generating 50 excess leads in a month when your technicians are already working overtime creates unserved callers and wasted capital.
- Lead Source Tracking: You must be able to link an incoming phone call or form submission directly to an estimate and a completed invoice.
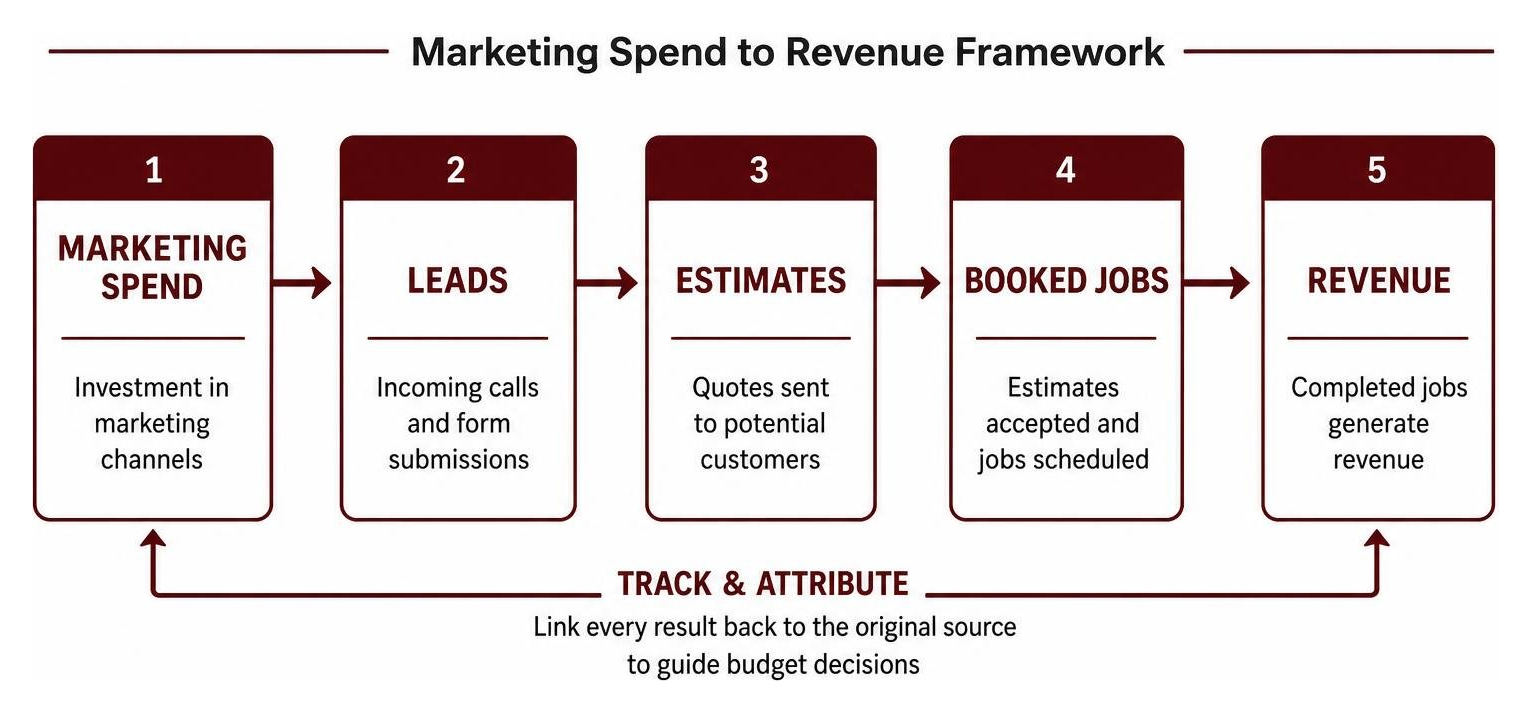
The U.S. Small Business Administration provides a widely cited baseline recommending that small businesses generating under $5 million in gross revenue allocate 7% to 8% of revenue to marketing, assuming net margins stay between 10% and 12%. However, for trade contractors, that target shifts based on your operational lifecycle, market competition, and target trade profile.
How Much Should a Contractor Spend on Marketing by Growth Stage
The amount of capital required to generate steady job flow depends heavily on your company’s stage of development. Newer businesses must pay to capture initial attention, while mature businesses can rely on existing customer databases, brand reputation, and referral networks.
According to the Contractor Marketing Budget: How Much to Spend in 2026 – Contractor Guide Pro, contractors must align their percentage targets with concrete operational outcomes rather than arbitrary industry rules of thumb.
Revenue Percentage Benchmarks: How Much Should a Contractor Spend on Marketing?
For established trade businesses, standard benchmarks fall into three primary operational tiers:
- Maintenance Mode (5% to 8%): This range is designed to replace normal customer churn, protect your local search footprint, keep existing service agreements active, and maintain consistent truck utilization without expanding overhead.
- Aggressive Growth Mode (8% to 12%): This tier is necessary when you are adding service vehicles, hiring additional technicians, expanding your physical service radius, or launching an adjacent trade service.
- Market Domination / Rapid Expansion (12% to 15%): Used when established operators look to capture market share across major metro markets or outspend competitors in high-ticket segments like major HVAC replacements or commercial roofing.
These targets assume standard industry gross margins. If your gross margin is thin due to pricing models or rising labor costs, marketing must be treated with tighter financial controls.
Early-Stage Operations: How Much Should a Contractor Spend on Marketing in Years 1 and 2?
A contractor in the first two years of operation typically needs to allocate 10% to 15% of projected revenue to marketing.
In the early stages, a company lacks three major assets that older competitors take for granted:
- A past-customer database for seasonal tune-ups and re-service reminders
- Established local organic map rankings and authority
- A steady baseline of word-of-mouth recommendations and online reviews
New businesses must buy market share through paid direct-response channels like Google Local Services Ads (LSAs) and targeted search advertising while simultaneously funding the foundation of their long-term digital assets.
Is 3 Percent of Revenue Enough for Marketing?
Spending 3% of revenue on marketing is rarely enough to drive growth. A 3% budget is essentially a maintenance budget for an established operator with an extensive repeat customer base and dominant local market presence.
Operating at 3% leaves a trade contractor vulnerable to three serious operational risks:
- Capacity Stagnation: You cannot generate enough inbound pipeline to justify hiring additional technicians or purchasing new service vehicles.
- Market Sensitivity: If a well-capitalized competitor enters your territory with heavy ad spend, a 3% budget cannot protect your lead share.
- Crew Retention Issues: When seasonal slowdowns hit, a 3% spend fails to produce enough service calls, forcing experienced technicians to look for hours elsewhere.
Three percent of revenue is enough to keep the lights on, but not enough to light the whole house.
Financial Inputs and Lead Generation Cost Benchmarks
Evaluating whether a marketing budget is efficient requires understanding live channel benchmarks across the home service and commercial contracting sectors. Lead costs vary widely depending on trade specialization, emergency intent, and local competition.
| Marketing Channel | Typical Cost Benchmark (2026) | Target Conversion to Estimate | Expected Booking Rate | Primary Asset Type |
|---|---|---|---|---|
| Google Local Services Ads (LSA) | $39–$57 per lead (trade dependent) | 70%–85% | 43.9% | Rented Direct Response |
| Google Search Ads (PPC) | $7.85 average CPC | 15%–25% | 35%–45% | Rented Direct Response |
| Organic Local Search & Maps | $1,500–$3,500/mo retainer | 30%–45% | 50%–60% | Owned Durable Asset |
| Customer Database Reactivation | $0.50–$2.00 per contact | 20%–35% | 60%–75% | Owned Internal Asset |
| Targeted Social Advertising | $25–$65 per inquiry | 10%–20% | 20%–30% | Rented Direct Response |
What Is a Good Cost Per Lead for Contractors in 2026?
According to Searchlight Digital performance data from February 2026, Google Local Services Ads average $53 per lead across the home services industry.
Lead costs break down further by specific trade:
- Electrical: ~$39 per lead
- HVAC: ~$51 per lead
- Plumbing: ~$57 per lead
- Roofing and General Remodeling: $85 to $130+ per lead
On average, platform data shows that Google Local Services leads convert to booked jobs at a rate of 43.9%. Meanwhile, home improvement Google Search advertising averages a cost per click (CPC) of $7.85 based on WordStream and LocaliQ benchmarks.
A good cost per lead (CPL) is ultimately determined by your average ticket size and closing percentage. Spending $100 for a qualified roofing lead makes sound financial sense on a $12,000 roof replacement, whereas that same $100 CPL would break the unit economics of a standard $180 drain clearing call.
Channel Allocation and Performance Tracking: CPL, CAC, and ROI
Allocating capital across marketing channels requires balancing rented direct-response lead generation with owned, durable marketing infrastructure. Rented channels can produce calls now, while owned assets can reduce acquisition costs over time.
A balanced budget allocation generally divides capital into these operational buckets:
- High-Intent Search & Paid Advertising: Direct-response platforms such as Google LSAs and paid digital advertisement campaigns designed to capture prospects with an immediate service need.
- Organic Visibility & Local Map Pack: Investing in durable SEO to rank in local search results and Google Maps across your core service ZIP codes. Local SEO retainers for competitive service trades typically run between $1,500 and $3,500 per month.
- Brand Awareness and Social Presence: Maintaining structured social media campaigns and review-generation systems to build trust and improve close rates on open estimates.
- Strategy and Attribution Infrastructure: Using a coherent marketing strategy with call tracking, CRM integration, and attribution software so you can connect spend to booked work.
Budget Allocation Examples: $500k vs. $2M Contractors
To see how this works in practice, consider two operational models based on an 8% gross-revenue budget:
The $500,000 Contractor ($3,333 Monthly Budget)
- Local Services Ads (LSA): $1,200/month for immediate emergency and repair calls
- Local SEO & Google Business Profile Management: $1,500/month to build local organic visibility
- Review Generation & Customer Reactivation Software: $300/month to reach past customers through SMS and email
- Call Tracking, Analytics, and Website Hosting: $333/month
The $2,000,000 Contractor ($13,333 Monthly Budget)
- Google Search (PPC) & Local Services Ads: $6,500/month to scale paid call volume across several service categories
- Advanced Local & Multi-Location SEO: $3,000/month to expand into neighboring service areas
- Targeted Social Retargeting & Brand Campaigns: $1,500/month to stay visible to past estimate recipients
- Database Marketing & Customer Retention Workflows: $833/month for maintenance-agreement and seasonal outreach
- Channel Testing Budget: $1,500/month to test recruitment campaigns, commercial outreach, or new platforms
Track These Three Core Contractor Metrics
Managing a contractor marketing budget requires tracking three core metrics every quarter. Use the same definitions in your CRM, call-tracking platform, and financial reports. Otherwise, a good-looking report can hide a bad result.
1. Cost Per Lead (CPL)
CPL measures what it costs to generate one trackable inquiry, such as a qualified phone call, web form, or booked diagnostic appointment. Do not divide spend by every click or spam call that enters the system.
$$\text{CPL} = \frac{\text{Channel Marketing Spend}}{\text{Qualified Leads}}$$
2. Marketing Customer Acquisition Cost (Marketing CAC)
Marketing CAC measures the marketing dollars required to win one paying customer or booked job. A full-company CAC can also include sales payroll and other sales costs, but keeping marketing CAC separate helps you judge a specific channel.
$$\text{Marketing CAC} = \frac{\text{Channel Marketing Spend}}{\text{New Paying Customers or Booked Jobs}}$$
3. Gross-Profit Marketing ROI
Revenue alone is not a return. Calculate marketing ROI from the gross profit left after direct job costs, then subtract the marketing investment.
$$\text{Gross-Profit Marketing ROI} = \frac{\text{Gross Profit from Attributed Jobs} – \text{Marketing Spend}}{\text{Marketing Spend}} \times 100$$
Practical Tracking Example
Consider an HVAC contractor spending $3,000 per month on Google Local Services Ads:
- Spend: $3,000
- Qualified leads: 58
- Booked jobs: 26 (about a 45% lead-to-booking rate)
- CPL: $3,000 ÷ 58 = $51.72
- Marketing CAC: $3,000 ÷ 26 = $115.38
- Average revenue per job: $1,200
- Gross margin: 45%
- Gross profit from those booked jobs: 26 × $1,200 × 45% = $14,040
- Gross-profit marketing ROI: ($14,040 − $3,000) ÷ $3,000 × 100 = 368%
This example assumes all 26 booked jobs are completed and paid. If jobs cancel, fail to collect, or have unusually high direct costs, the real return is lower. That is precisely why contractors should tie marketing reports to completed invoices and gross profit, not just leads or sales booked on the calendar.
Strategic Budget Management: Handling Capacity Swings and Agency Performance
A common error among trade contractors is treating marketing spend like a faucet: turning it wide open during shoulder seasons and shutting it off completely when dispatch boards are full.
Should I Cut Marketing When I Am Booked Out?
Do not shut your marketing budget down when your schedule is booked weeks out.
In contracting, marketing operates on a 60 to 90 day pipeline lag. The SEO investments, brand impressions, and paid direct-response campaigns executed today create the estimates and installations you complete two months from now.
When you cut marketing spend to zero during a busy spell:
- A pause can cost you momentum. When you restart, the platform has to adjust to what’s working now.
- Your organic momentum slows while competitors continue building authority.
- Your incoming pipeline dries up precisely when your current booked jobs wrap up, creating severe revenue valleys.
Instead of turning off your budget, throttle your spending strategically. Lower your bids on high-ticket direct-response ads, shift ad copy to higher-margin services, or raise your minimum estimate fee. This protects schedule density while maintaining marketing continuity.
When Should I Fire My Marketing Agency?
Contractors frequently find themselves cycling through disconnected marketing vendors who provide complex performance reports that show high click volume but no clear connection to booked work.
You should consider parting ways with a marketing vendor when:
- They cannot provide source-by-source lead and booking attribution after 90 days: If an agency cannot tell you which leads generated revenue versus spam calls, they cannot manage your budget effectively.
- They refuse to track Customer Acquisition Cost (CAC) and Gross Profit ROI: Focusing solely on impressions, clicks, or raw form fills ignores whether those leads converted into profitable field operations.
- They hold your digital assets hostage: You should own your domain, website files, Google Business Profile, ad accounts, and call-tracking data. If parting ways requires rebuilding your web assets from scratch, the partnership is structured against your business interests.
- They recommend isolated tactics instead of managing your full marketing workflow: Hiring one vendor for SEO, another for Google Ads, and a third for website updates creates misaligned goals and finger-pointing when lead volume drops.
Aligning Marketing Spend with Scalable Operational Capacity
Managing your marketing investment requires treating customer acquisition as a core operational discipline. Rather than bouncing between uncoordinated vendors or chasing temporary marketing tactics, established trade companies need an organized operating rhythm.
The OODA Group operates as a managed marketing partner, functioning as an outsourced marketing department for established home-service and contracting companies. We use the Observe, Orient, Decide, Act (OODA) framework to continuously analyze actual field dispatch data, lead quality, and customer acquisition costs.
Using our Keep, Connect, Replace, or Retire methodology, we audit your current marketing tech stack, software integrations, and advertising channels to eliminate wasted spend and protect profitability. To build a predictable customer pipeline backed by clear operational data, review our approach to contractor construction marketing.